
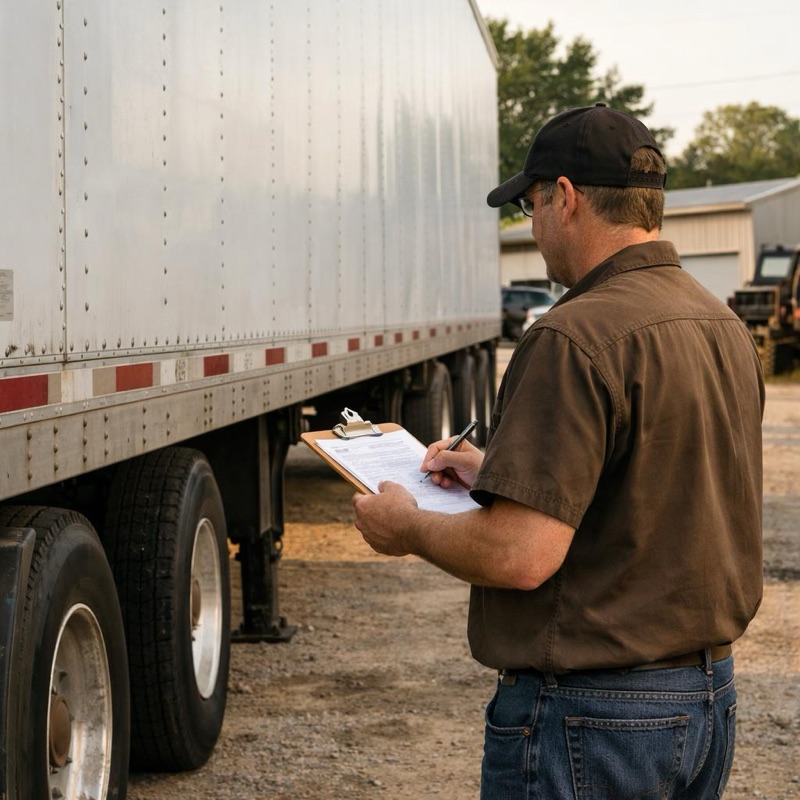
The short answer: trucking companies sell for an average of 3.11× SDE (across 34 reported transactions) or about 0.72× revenue, with the trucks and trailers valued inside the deal. In dollars: roughly $620,000 for a company producing $200,000 of SDE, and around $1.4M for a $2M-revenue operation on the revenue method. One of our own members did exactly this: a member's public review describes buying a trucking company after a year in the program and leaving his W-2 (Trustpilot, June 2026).
Why buyers pick trucking, and what they underestimate
Freight is the economy's plumbing: the demand never goes away, contracts and dedicated lanes can make revenue predictable, and the barrier to entry for a new competitor with financed trucks is real. What buyers underestimate is that a trucking company is two retention problems wearing one DOT number: drivers, in an industry where turnover is a structural fact, and freight relationships, where a broker or shipper can reroute volume the week the seller leaves. The multiple you pay should reflect how well both are locked in.
The equipment cuts both ways. Trucks give the deal hard-asset collateral lenders like, and they carry age, mileage, and maintenance liabilities that arrive on your watch. A fleet list with years, miles, and maintenance records is not an attachment to the deal; it is half the deal.
What trucking companies sell for
| Measure | Figure | Notes |
|---|---|---|
| SDE multiple | 3.11× average | Across 34 reported trucking transactions |
| Revenue multiple | 0.72× average | Same dataset |
| Worked example | $200K SDE → ~$620,000 | At the average multiple, fleet condition adjusts from there |
| Pushes the price up | Pulls it down |
|---|---|
| Dedicated lanes or contract freight | Pure spot-market exposure |
| Drivers with tenure and clean records | Turnover churning through recruiting spend |
| Diversified shippers and brokers | One customer moving most of the freight |
| A younger, maintained fleet with records | Aged trucks facing engine and emissions work |
| Clean safety scores | A safety record that raises insurance and loses shippers |
| Business size | Implied price | Note |
|---|---|---|
| $750,000 revenue | ~$540,000 | Owner-driver plus two or three trucks |
| $2M revenue | ~$1.4M | Small fleet with a dispatcher |
| $5M revenue | ~$3.6M | Fleet economics; EBITDA pricing takes over |
Illustrative sizes priced at the dataset average; fleet age and freight quality move a specific company well off these marks.
The diligence that makes or breaks a trucking deal
| What to verify | The question it answers | Where it shows up |
|---|---|---|
| Customer and lane concentration | Does the freight survive the seller's exit? | Revenue by shipper and broker, 24 months |
| Driver roster | Who stays, and what does replacing them cost? | Payroll tenure, pay structure vs local market |
| Fleet condition | What capital does year one need? | Unit-by-unit list: year, mileage, maintenance records |
| Safety and compliance record | Will insurance and shippers accept the operation? | FMCSA safety data; insurance loss runs |
| Rates and fuel exposure | Are today's margins reproducible? | Rate confirmations; fuel-surcharge terms |
The number that catches inflated trucking deals
Revenue per truck against the fleet list. Stated revenue that implies more loaded miles than the trucks and drivers on the roster could have run is telling you the books include freight that will not convey, or never existed.
Operating authority and insurance transfer are structural: whether the deal keeps the company's DOT/MC authority (a stock-style sale) or you bring your own (an asset sale) changes insurance, shipper onboarding, and timeline, one more reason the asset-vs-stock choice matters more here than in most industries.
How a typical trucking purchase is financed
| Source | Amount | % of price |
|---|---|---|
| SBA 7(a) loan | $720,000 | 90% |
| Equity injection (total) | $80,000 | 10% |
| of which: standby seller note can cover | up to $40,000 | up to 5% |
| of which: your cash portion | as low as ~$40,000 | ~5% |
The hard assets help the loan and the appraisal, and equipment-heavy deals sometimes blend equipment financing with the 7(a); the stack logic is in the acquisition financing guide.
Run a trucking deal through the calculator
Where to find trucking companies for sale
| Channel | What you find there | How to work it |
|---|---|---|
| Marketplaces | Owner-operator and small-fleet listings | Alerts on; see the marketplace comparison |
| Transport-specialist brokers | Larger fleets and contract-freight operations | Brief them on lanes, fleet size, and region |
| Direct outreach | Owner-drivers aging out; shippers often know who is selling | The off-market playbook |
Found a fleet with real freight behind it?
The free training walks the playbook a member used to buy a trucking company and leave his W-2.
Every claim checkable: member closings, self-reported and published unedited.
Frequently asked questions
Trucking companies sell for an average of 3.11 times SDE across 34 reported transactions, or about 0.72 times revenue, with trucks and trailers valued inside the deal. A company producing $200,000 of SDE prices around $620,000 at the average.
Two assets can drive away: drivers, in an industry where turnover is structural, and freight relationships, where a shipper or broker can reroute volume when the seller exits. Diligence lives in the driver roster, the customer concentration, and the rate confirmations.
Usually yes, and they are half the deal: get a unit-by-unit fleet list with years, mileage, and maintenance records, because deferred fleet maintenance becomes your capital plan in year one. The hard assets also support the loan.
It depends on the structure: a stock-style sale keeps the company's DOT/MC authority and insurance history; an asset sale means operating under your own authority, which changes insurance and shipper onboarding. Decide this early, with your attorney.
Yes, with the standard 10% equity injection, about $80,000 on an $800,000 company, up to half available as a standby seller note, and the equipment provides collateral lenders like.
Sources
Multiples and transaction counts: Sundance Financial, SDE Multiples by Industry (2026), averages across 9,500+ small-business transactions reported in 2025. Member outcome: public Trustpilot review of Acquisition Ace (Kevin Jin, June 2026), self-reported. Safety data: FMCSA public records. SBA mechanics: our equity injection guide.