
Why the WIP schedule is the valuation
Construction profit is earned across months and recognized on paper, which is why the work-in-progress schedule is the single document that decides whether stated earnings are real. Billings ahead of costs can dress a weak year; a WIP that ties job by job to contracts and costs cannot. Above it sits the backlog: signed work with verified remaining margin is an asset, while a pipeline of maybes is a story. And underneath everything: whether the license and bonding capacity transfer, because a contractor that cannot bid after closing is a truck full of tools.
What buyers check first
- WIP schedule, job by job. Tied to contracts, billings, and costs; the overstatement check for this industry.
- Backlog contracts and change orders. Executed paper with margin remaining, not the pipeline conversation.
- License and bonding transfer. State board rules and the surety relationship; can the company keep bidding?
- Estimator and PM retention. Who wins and runs the next job when the seller leaves?
The backlog is the business you are buying. The WIP schedule is whether it was ever real.
General vs heavy, and where EBITDA takes over
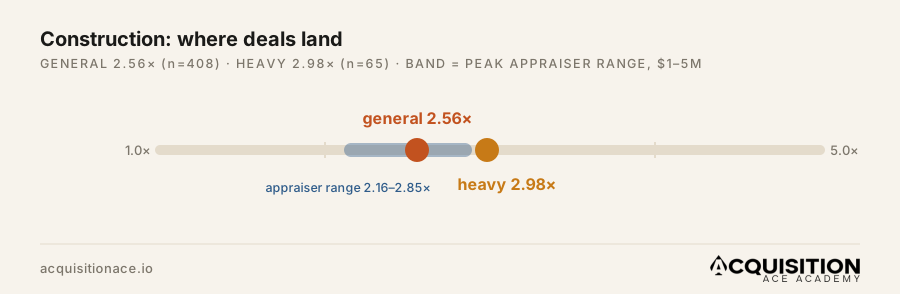
The 0.42× gap between general (2.56×) and heavy construction (2.98×) reflects equipment intensity and contract durability. At the small end, SBA-financed asset deals dominate with the standard injection math; past roughly $8M of bonded commercial revenue, buyers price on EBITDA and the surety relationship becomes the real gatekeeper of the deal.
Buyer's move
Ask for the WIP schedule before the P&L. A seller who produces a clean, job-tied WIP in a day runs a real company; one who needs three weeks is telling you where the diligence will end.
Where it sits in its aisle
| Vertical | SDE multiple | Reported deals |
|---|---|---|
| Building material & hardware | 3.40× | 29 |
| Concrete | 3.04× | 21 |
| Heavy construction | 2.98× | 65 |
| Electrical & mechanical | 2.94× | 57 |
| HVAC | 2.80× | 123 |
| Plumbing | 2.62× | 61 |
| Other construction (general) | 2.56× | 408 |
Deal size and the multiple
One honest limitation of transaction averages: the dataset reports multiples, not deal sizes, and reported Main Street transactions skew toward smaller companies, so the averages above describe the heart of that market. Size changes the auction. At $500K+ of SDE the buyer pool shifts from individual owner-operators to searchers, funds, and family offices competing for the same listing, and construction companies at that size routinely price above the table. Read the average as the floor of the conversation on a larger deal, not the ceiling, and compare businesses to others of their own size before comparing across industries.
Reading a construction listing against the average
General construction prices at the bottom of its own aisle (2.56× across 408 deals) because project revenue is the hardest kind to transfer. The listing checks that matter: backlog quality, signed contracts with dates and margins rather than a pipeline narrative; bonding, whether the company's bonding capacity survives the seller's exit, since it often rides on the owner's balance sheet; and who holds the licenses, because a qualifier walking out the door can idle the whole book. The fourth file is job-size concentration: ask for revenue broken down by job. A $4M contractor leaning on one $1M project a year is carrying a cliff, because cash flow drops hard in the year that job is not repeated, and the industry's cyclical nature makes such a year likely eventually. Heavy construction's 2.98× premium tracks equipment weight and public-work contracts. Worked financing on the cost-to-buy page.
Sources
- Sundance Financial, SDE Multiples by Industry (2026), averages across 9,500+ small-business transactions reported in 2025.
- Peak Business Valuation, construction ranges ($1–5M cohort).
Construction valuation multiples, FAQ
General construction averaged 2.56× SDE across 408 reported transactions, heavy construction 2.98× across 65, with appraiser ranges at 2.16–2.85× for the $1–5M cohort. Backlog and bonding transferability set the position.
Equipment intensity and more durable contract relationships: the 2.98× average against 2.56× reflects buyers paying for committed work and the machinery that performs it, valued inside the deal.
About $1.8M at the 0.60× revenue average, with the SDE method and backlog quality deciding the real number. A verified-margin backlog prices above the average; billings running ahead of costs price below it.
Keep going
Compare every sector on the industry multiples hub, learn the buy playbook in our how to buy a construction business guide, see the cash-to-close math on the cost to buy page, and price a deal with the valuation calculator.
Put a real number on a real deal
Drop in SDE and an asking price, our calculator returns a value range and a financing check in seconds.