
Why the freight mix sets the band
Revenue quality in trucking is the contract behind the load. Dedicated lanes and contract freight survive the seller's exit; spot-market revenue is repriced every week by the market. Behind the freight sit the two cost cliffs buyers underwrite hardest: driver tenure (replacing drivers consumes margin through recruiting and insurance) and fleet age, because a row of trucks facing engine and emissions work is a capital call wearing a balance sheet.
What buyers check first
- Customer and lane concentration. Revenue by shipper and broker across 24 months; whose relationship is the freight?
- Driver roster and pay structure. Payroll tenure against the local market; who stays after closing?
- Fleet, unit by unit. Year, mileage, maintenance records; the real year-one capital need.
- Safety and insurance record. FMCSA data and loss runs; a bad score raises insurance and loses shippers.
You are not buying trucks. You are buying freight that keeps moving after the seller stops answering the phone.
The fleet inside the price
Unlike property-heavy deals, the equipment here is valued inside the multiple, which is why two companies at the same SDE diverge on fleet age alone. SBA-financed asset purchases are standard, the injection runs on total project cost, and lenders will read the same unit list you should: a maintained, mid-life fleet finances smoothly; an aged one shrinks the loan and grows your cash need.
Buyer's move
Price the fleet separately before accepting the blended number: unit-by-unit year, mileage, and maintenance history. The gap between the asking price and the same company with five-year-newer trucks is your negotiation.
Where it sits in its aisle
| Vertical | SDE multiple | Reported deals |
|---|---|---|
| Towing companies | 3.44× | 12 |
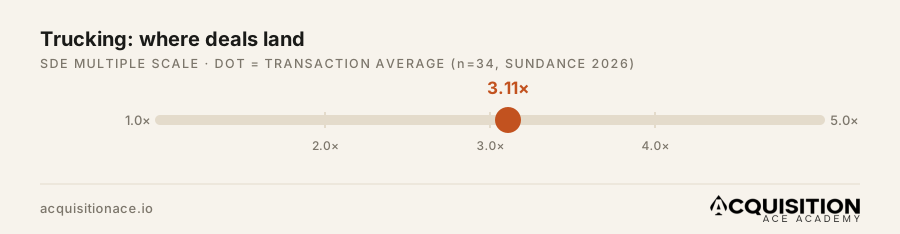
| Trucking companies | 3.11× | 34 |
| Moving & shipping | 2.86× | 62 |
| Limo & passenger transport | 2.61× | 21 |
| Routes (delivery/vending) | 1.51× | 496 |
Deal size and the multiple
One honest limitation of transaction averages: the dataset reports multiples, not deal sizes, and reported Main Street transactions skew toward smaller companies, so the averages above describe the heart of that market. Size changes the auction. At $500K+ of SDE the buyer pool shifts from individual owner-operators to searchers, funds, and family offices competing for the same listing, and trucking companies at that size routinely price above the table. Read the average as the floor of the conversation on a larger deal, not the ceiling, and compare businesses to others of their own size before comparing across industries.
Reading a trucking listing against the average
The aisle table carries a warning in both directions. Routes price at 1.51× because a delivery route is cash flow bolted to a contract someone else controls; trucking at 3.11× is priced for owning the customer relationships and the equipment. So on any listing: the fleet list first (unit-by-unit, year, mileage, maintenance records, because deferred maintenance is your year-one capital plan), then customer concentration (a shipper that can reroute volume when the seller exits is the route problem wearing a trucking price), then the driver roster in an industry where turnover is structural. And put one more number in the file: annual capital expenditure. Trucks and trailers get replaced on a cycle, and that capex is real cash leaving the account before debt service and your own pay, so a listing SDE that ignores the replacement cycle overstates what the business can actually carry. Worked financing on the cost-to-buy page; the full guide is here.
Sources
- Sundance Financial, SDE Multiples by Industry (2026), averages across 9,500+ small-business transactions reported in 2025.
Trucking valuation multiples, FAQ
An average of 3.11× SDE across 34 reported transactions, or about 0.72× revenue, with trucks and trailers valued inside the deal. Contract freight and fleet condition set the position against the averages.
In these figures, yes: the multiple prices the operating company with its equipment. That is why fleet age moves the number so hard, and why a unit-by-unit list belongs in diligence before any offer.
About $1.4M at the 0.72× revenue average, assuming a maintained fleet and diversified freight. Heavy spot-market exposure or an aged fleet prices below the average; dedicated contract lanes price above it.
Keep going
Compare every sector on the industry multiples hub, learn the buy playbook in our how to buy a trucking company guide, see the cash-to-close math on the cost to buy page, and price a deal with the valuation calculator.
Put a real number on a real deal
Drop in SDE and an asking price, our calculator returns a value range and a financing check in seconds.