
Why payer mix is the multiple
Two agencies with identical revenue can sit far apart because who pays, and who sets the rate, differs. Private-pay-heavy agencies set their own prices and collect quickly; an agency dependent on one Medicaid waiver program inherits that program's rate decisions and its re-credentialing risk at change of ownership. Behind the payer question sits the workforce: caregiver turnover caps billable hours no matter what the census looks like, so a stable roster with a real recruiting pipeline is priced as the asset it is.
What buyers check first
- Payer mix and rate setters. Billing system by payer; program rate schedules; who can change the price of an hour.
- Staffed hours against billed hours. Scheduling records reconciled to invoices and payroll; capacity must be real.
- Referral source concentration. A census fed by one discharge planner is a relationship, not a business.
- License and survey history. State file and change-of-ownership rules; re-credentialing timelines differ by state.
The census is the revenue. The caregiver roster is whether you keep it.
Change of ownership is a licensing event
Home care transfers are shaped by state licensing and payer re-credentialing: the buyer must be approved to operate and to bill, and gaps leak clients immediately. Deals are typically SBA-financed asset purchases with the injection on total project cost; the diligence that matters is the billing reconciliation and the license file, both checkable before the offer.
Buyer's move
Reconcile three months of scheduling data against invoices and payroll before pricing. Hours billed that the visit logs cannot support are the fastest overstatement check in this industry.
Where it sits in its aisle
| Vertical | SDE multiple | Reported deals |
|---|---|---|
| Dental practices | 3.28× | 22 |
| Assisted living & nursing homes | 3.18× | 27 |
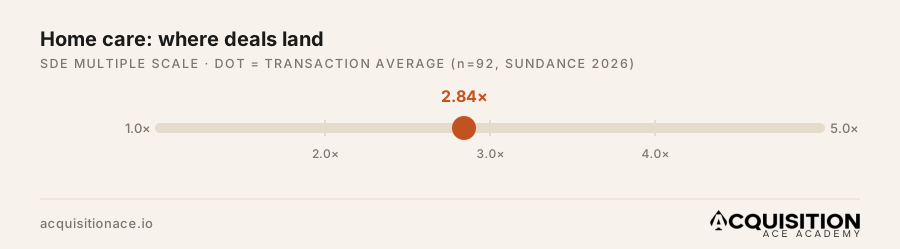
| Home health care | 2.84× | 92 |
| Other health care | 2.79× | 84 |
| Medical practices | 2.58× | 139 |
| Gyms & fitness centers | 2.44× | 79 |
Deal size and the multiple
One honest limitation of transaction averages: the dataset reports multiples, not deal sizes, and reported Main Street transactions skew toward smaller companies, so the averages above describe the heart of that market. Size changes the auction. At $500K+ of SDE the buyer pool shifts from individual owner-operators to searchers, funds, and family offices competing for the same listing, and home care agencies at that size routinely price above the table. Read the average as the floor of the conversation on a larger deal, not the ceiling, and compare businesses to others of their own size before comparing across industries.
Reading a home care listing against the average
Three checks sort listings fast. Payer mix first: private-pay revenue and Medicaid/Medicare revenue are different businesses wearing one license, and the mix explains most of the distance between a listing and the 2.84× anchor. The license and the census: a change of ownership typically needs state approval and payer re-credentialing, and every week of delay leaks the census you are buying. Caregiver roster: in a labor-rationed market, the real asset is scheduled, credentialed caregivers; turnover data belongs in diligence, not in the first month of ownership. The financing math for a worked deal is on the cost-to-buy page.
Sources
- Sundance Financial, SDE Multiples by Industry (2026), averages across 9,500+ small-business transactions reported in 2025.
Home Care valuation multiples, FAQ
An average of 2.84× SDE across 92 reported home health transactions, or about 0.60× revenue. Payer mix and caregiver stability decide where a specific agency lands against those averages.
The dataset average blends both, and buyers consistently pay above it for private-pay-heavy books that set their own rates, and below it for single-program Medicaid dependence with its rate and re-credentialing risk.
About $600,000 at the 0.60× revenue average, with the SDE method usually pricing a well-run staffed agency higher. Both methods are on this page; the guide covers the diligence that moves the number.
Keep going
Compare every sector on the industry multiples hub, learn the buy playbook in our how to buy a home care business guide, see the cash-to-close math on the cost to buy page, and price a deal with the valuation calculator.
Put a real number on a real deal
Drop in SDE and an asking price, our calculator returns a value range and a financing check in seconds.